Chapter 1 |
|
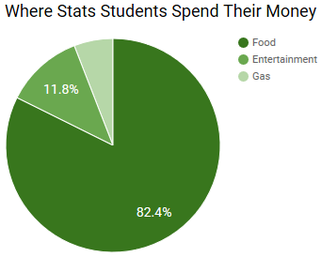
My partner Hanna and I choose to complete our chapter 1 project on the question: Where does the stats class's money go? We completed a survey of the stats class asking each person if they spent most of their money on food, gas, entertainment, or game tickets. We found that a great majority of the class spent their money on food over the other categories. From this project, my partner and I learned that more specific categories to choose from allows for more detailed and interesting data.
|
Chapter 2 |
|
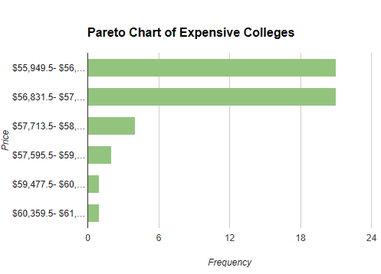
For our chapter 2 project, my partner, Ashley, and I choose to find which colleges are the most expensive. We found a list of the fifty most expensive colleges and created a variety of graphs to display the data. By completing this project, we found that the price of higher education per year is very expensive and the price continues to rise at an alarming rate. My partner Ashley and I learned that in order to attend prestigious colleges in the U.S. students pay more than a reasonable amount.
|
Chapter 3 |
|
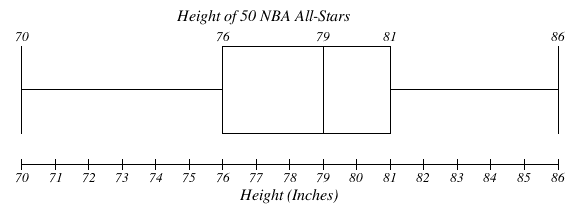
My partner Katie and I decided to complete our chapter 3 project on the height of 50 NBA all-stars. We wanted to know the average height of the basketball players who were awarded with this title. After compiling our data, we found that the average height was 78.36 inches. From this project we learned that many all-star basketball players fall between the height of 70 to 86 inches.
|
Chapter 4 |
|
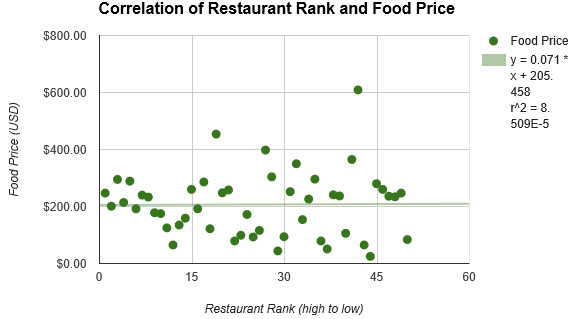
For the chapter 4 project, my partner Maddie and I wanted to find the correlation between restaurant rank and price. We thought that we would find that as rank increased price would increase, but that was not the case. We found that restaurant rank had almost no correlation to the price of the menu. What we learned from this project is that the price of food at a restaurant is not an accurate indicator of the taste.
|
Chapter 5 |
|
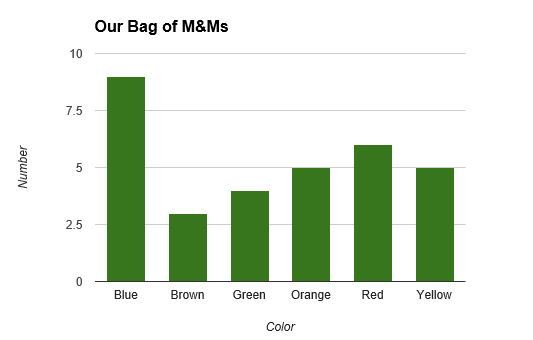
For the chapter 5 project Austin, Gunnar, and I wanted to know the probability of picking an M&M out of a bag and choosing a certain color. We found that the bag we choose from there was a high chance of choosing blue and a low chance of picking a brown. From completing this project, we learned that the probability of pulling an M&M out of a bag depends on the size of the bag and the amount of each color in the bag.
|
Chapter 6 |
|
For this project, my partners Ashlynn, Mitch, and I calculated probabilities based on the Powerball. Using the random number table, we compared our numbers to the set winning numbers chosen from a previous lottery. We found that it is very difficult to win even a small amount of money with our random numbers. From this we learned that gambling is a game of chance and your expected earnings from playing are very low.
|
Chapter 7 |
|
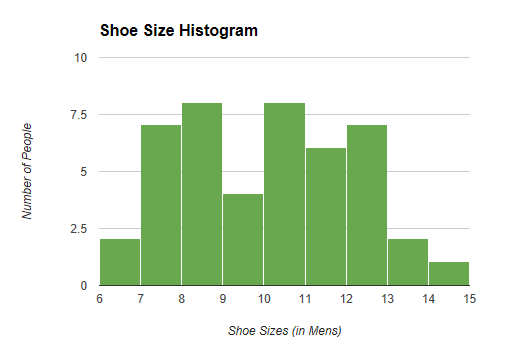
For our chapter 7 project, Dallas, Delanie, and I wanted to find the average shoe size of the juniors and seniors. From our data we were able to find the probability that someone's shoe size was larger than our own. I learned from this project that I have an 80.2% chance of finding someone with a larger shoe size than mine.
|
Chapter 8 |
|
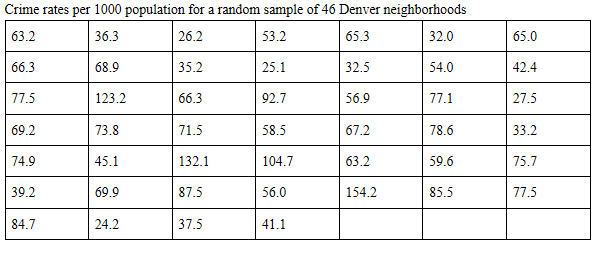
For our chapter 8 project, my partner Cody and I were given a random sample of the crime rates in Denver neighborhoods. From this data, we were able to find the average crime rate for Denver is 53.1<u<75.2 with 99% confidence. This project helped me to learn how to take sample data to calculate the population average range with a certain percentage of confidence.
|
Chapter 9 |

|
My partner Erin and I decided to ask random seniors how many minutes they spend on Facebook everyday. We found that many of the seniors answered with zero minutes contributing to the average of 8.7 minutes. From completing this project, I learned that the amount of Facebook users in the senior class is much less than the world average.
|
Chapter 10 |

|
For the chapter 10 project, my partner Ryan and I compared education levels of two different age groups. We found that there was a difference between the two age groups level of education and that the younger group was more educated than the other group. From this project I learned that it is important to calculate confidence intervals to be sure that your conclusion was correct.
|
